Invested capital

Distribution invested capital

Distribution invested capital funds and mandates
x € thousands, unless otherwise stated
| | 2018 | 2017 |
Europe Mandate | 1,105,832 | 1,009,180 |
North America Mandate | 1,170,903 | 1,023,604 |
Asia-Pacific Mandate | 893,324 | 629,427 |
Dutch Residential Fund | 5,761,761 | 4,751,642 |
Dutch Retail Fund | 969,680 | 888,896 |
Dutch Office Fund | 771,241 | 631,446 |
Dutch Hotel Fund | 259,111 | 221,610 |
Dutch Healthcare Fund | 178,443 | 112,001 |
Other | 167,516 | 156,206 |
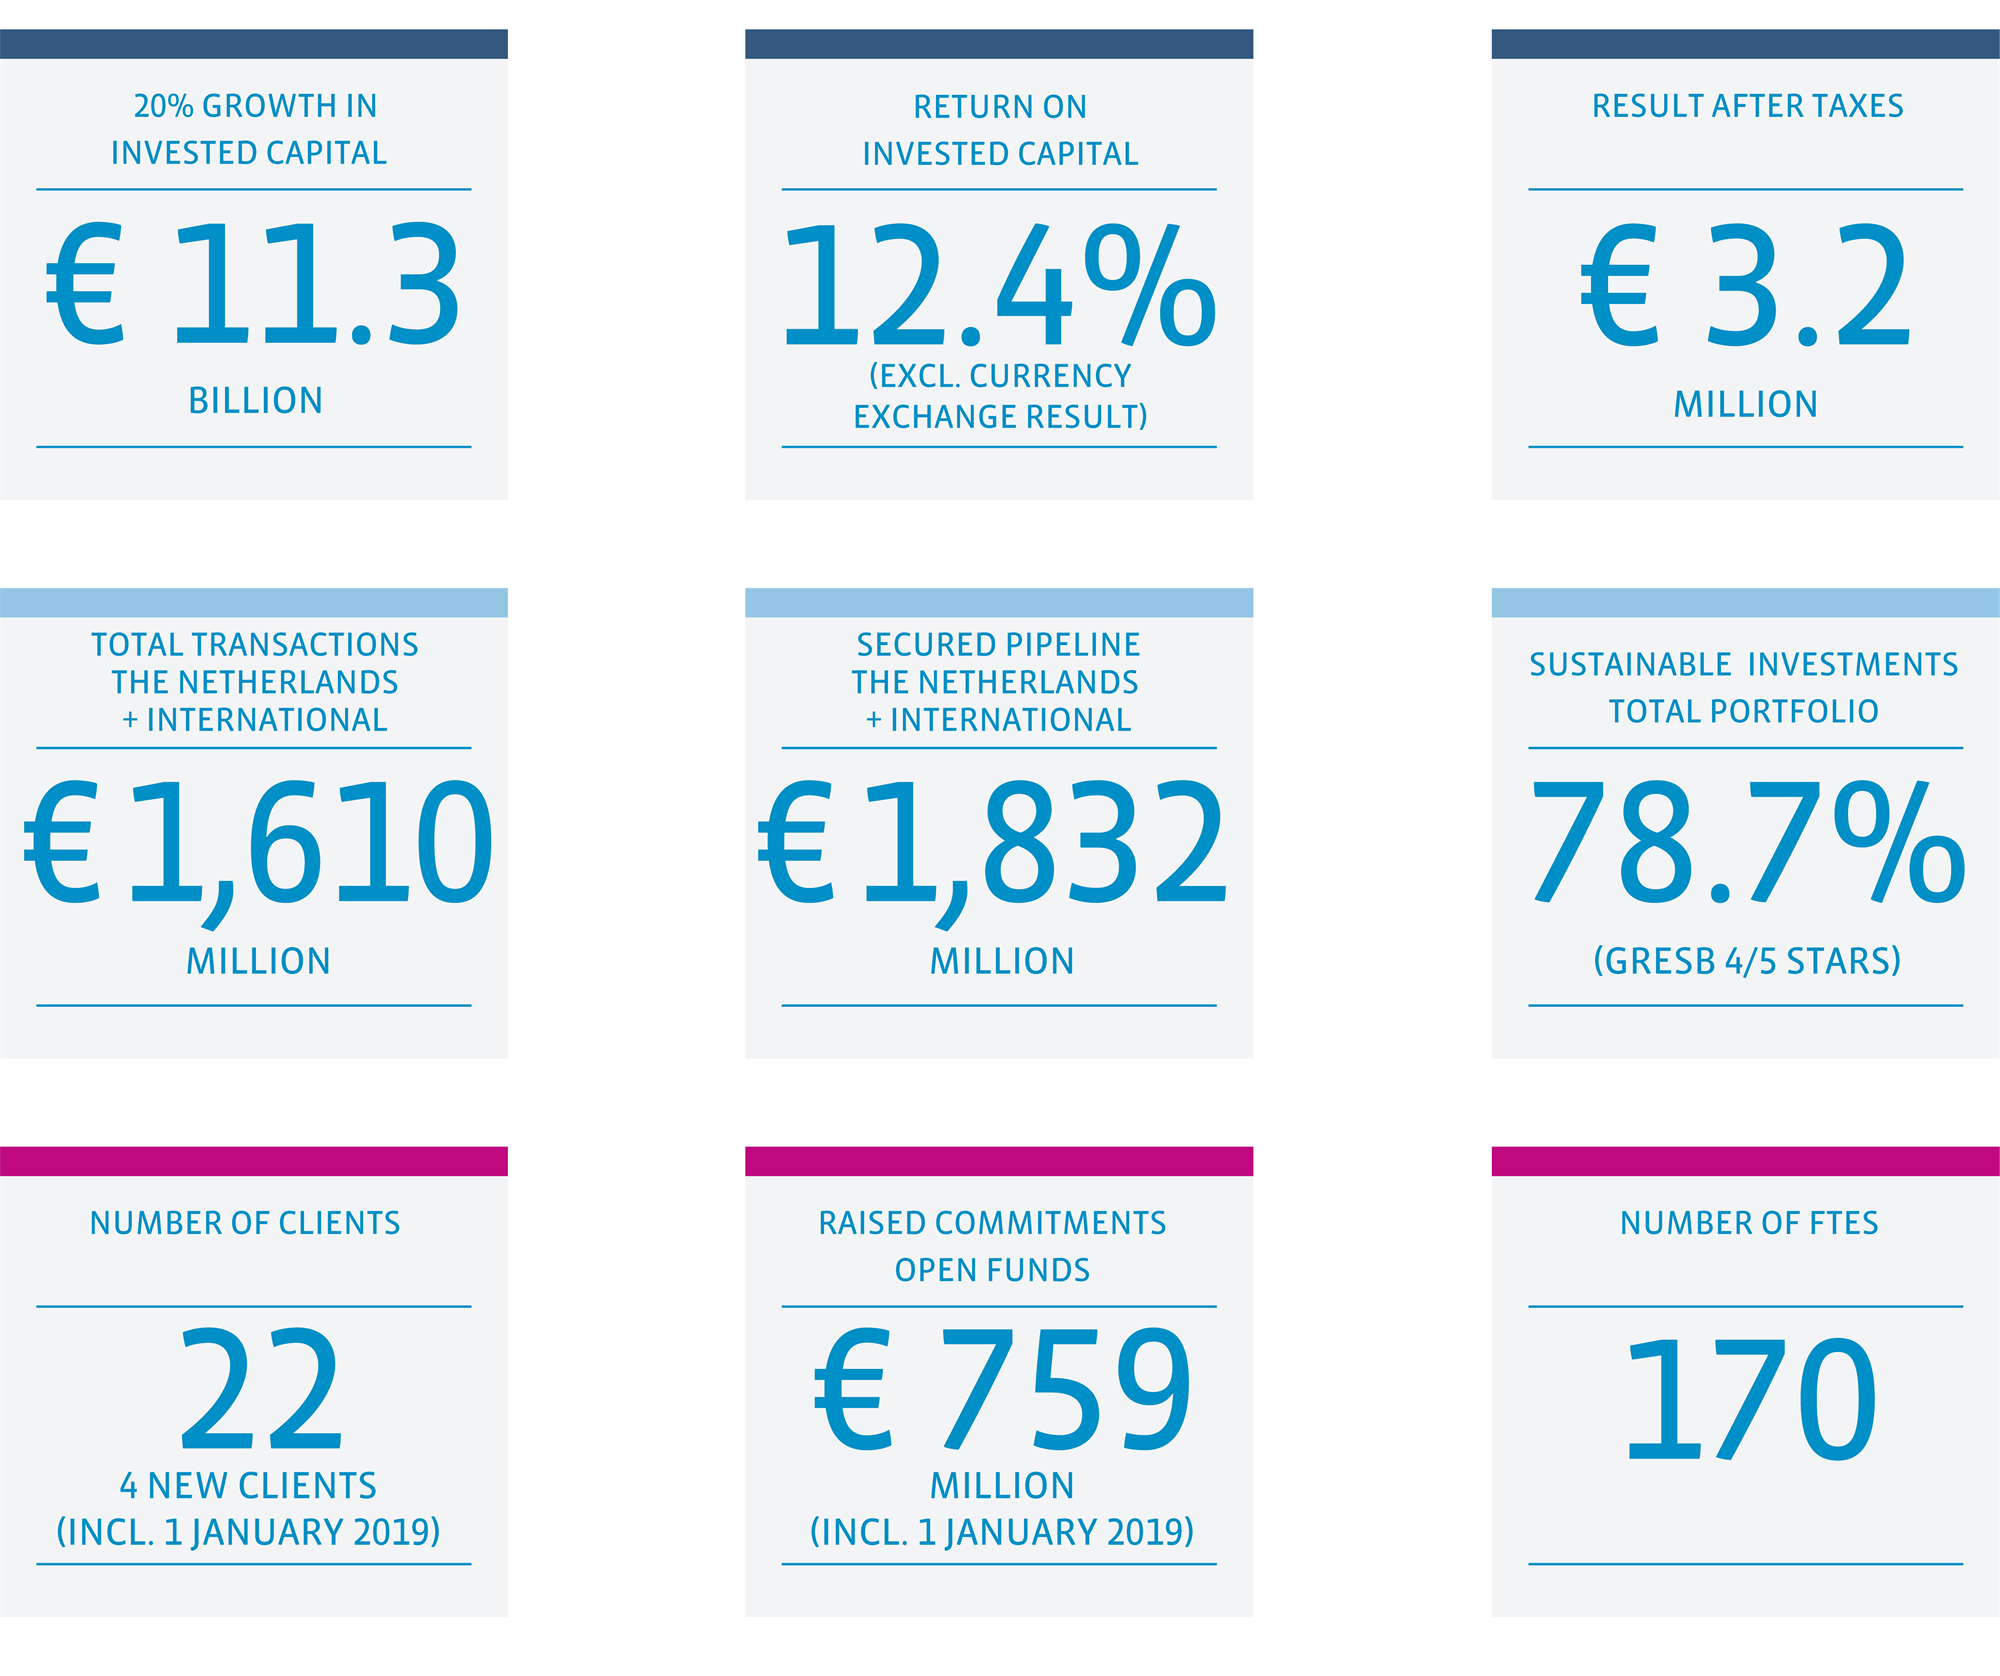
| | 11,277,811 | 9,424,012 |
Return on invested capital

Transactions
x € million
Transactions | 2018 | 2017 |
International | | |
Europe Mandate | 100 | 115 |
North America Mandate | 442 | 145 |
Asia-Pacific Mandate | 311 | 102 |
| | 853 | 362 |
| | | |
The Netherlands | | |
Dutch Residential Fund | 480 | 300 |
Dutch Retail Fund | 53 | 50 |
Dutch Office Fund | 167 | - |
Dutch Hotel Fund | - | - |
Dutch Healthcare Fund | 57 | 73 |
| | 757 | 423 |
| | | |
Total | 1,610 | 785 |
Overview responsible investment & business

Figures satisfaction survey
Results satisfaction surveys | most recent | previous |
Investors | 7.9 (2016) | 7.7 (2014) |
Employees | 8 (2017) | 8 (2015) |
Tenants | 7.3 (2018) | 6.7 (2017) |
Key information over five years
x € thousands, unless otherwise stated
| | 2018 | 2017 | 2016 | 2015 | 2014 |
| | | | | | |
Number of shares (actual) | 225,000 | 225,000 | 225,000 | 225,000 | 225,000 |
| | | | | | |
Net result | 3,175 | 4,660 | 2,595 | 4,422 | 3,173 |
Per share | 14.11 | 20.71 | 11.53 | 19.65 | 14.10 |
| | | | | | |
Assets under management | 11,277,811 | 9,424,012 | 8,456,869 | 7,495,325 | 6,700,206 |
| | | | | | |
Total assets | 47,301 | 43,287 | 36,889 | 33,010 | 30,770 |
| | | | | | |
Shareholders’ equity | 33,152 | 33,977 | 29,317 | 29,422 | 27,186 |
Per share | 147.34 | 151.01 | 130.30 | 130.76 | 120.83 |
| | | | | | |
Solvency ratio | 70% | 78% | 79% | 89% | 88% |
| | | | | | |
Management fee income | 38,474 | 34,288 | 30,722 | 30,503 | 27,854 |
| | | | | | |
Personnel costs | 24,867 | 20,846 | 19,276 | 17,959 | 17,014 |
Number of FTEs (year-end) | 169.7 | 152.5 | 136.6 | 131.1 | 128.0 |
Personnel costs per FTE | 146.5 | 136.7 | 141.1 | 137.0 | 132.9 |
Fee per FTE | 226.7 | 224.8 | 224.9 | 232.7 | 217.6 |